
25 Jaw-Dropping eCommerce Statistics to Boost Your Sales in 2021
There’s no room for guesswork when it comes to running and growing a profitable ecommerce business. Business decisions that are based on hard ecommerce statistics, facts and figures are more likely to result in successful outcomes. Understanding the story that this data is telling you can reap great rewards and looking back is the first step to helping you plan ahead and achieve the outcomes you’re striving for.
eCommerce statistics 2020 – looking back
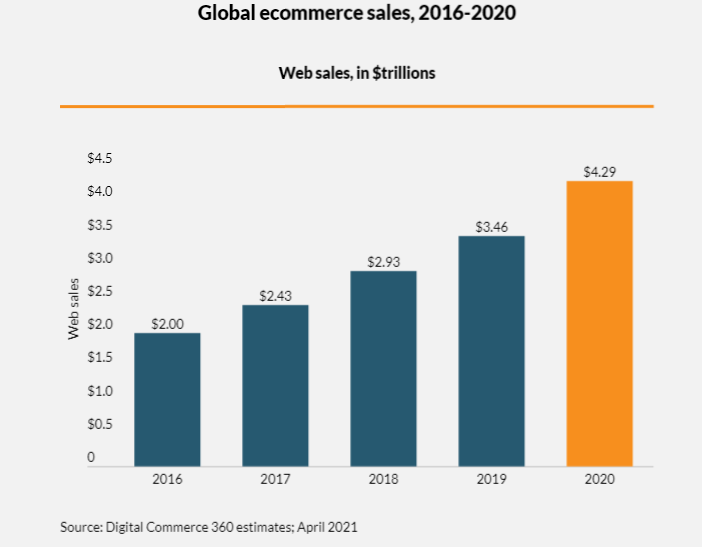
During 2020, more than two billion consumers worldwide bought products or services online, and global ecommerce sales exceeded $4.2 trillion – that’s a whopping 27.6% increase from the previous year! While the global pandemic played a large part in the surge in ecommerce usage statistics, as people became home-bound and stores were shut tight, it’s likely that this is a trend that will continue through 2021 and beyond since there are many advantages of ecommerce to consumers and businesses alike.
Now that we’ve set the scene for the current state of the ecommerce market, here are some other important global ecommerce statistics from 2020 that every store owner should know:
1. At the height of the pandemic, during June 2020, global ecommerce traffic hit a record high of 22 billion visits during the month of June 2020.
2. Items such as clothing, groceries and tech products were in particular demand, which comes as no surprise in light of the COVID lockdowns.
3. 62.5% of global ecommerce in 2020 was attributed to online marketplaces – a year-on-year increase of 60.1%!
Key takeaway:
What is the significance of these online ecommerce statistics in 2021? How can they help you shape your e commerce business activity? It’s simply not enough to look at the numbers without figuring out the story they are telling you and how you can use the ecommerce facts and figures to optimize your business.
This guide will assist you in making data-driven decisions for your ecommerce business in 2021.
Shopify statistics
Shopify is one of the leading ecommerce platforms and the following Shopify statistics 2020 show why:
4. In 2020, more than 44 million consumers bought goods through Shopify merchants
5. 79% of Shopify traffic is from mobile devices
6. There are more than 3,200 apps in the Shopify app store
Key takeaway:
Being that the majority of Shopify visitors arrive through their mobile devices, it’s important to optimize your store for mobile.
What did we learn in 2020?
In 2020, we learned how important it is to be agile. Those businesses that adapted quickest to the global crisis, forged ahead. Retail stores that were already had a multi-channel approach and were already online, were able to take advantage of the boom in online shopping and fared better than their brick-and-mortar counterparts that failed to adapt.
The most important ecommerce statistics to know:
Each of these statistics is not just nice to know, they serve the purpose of helping you focus and optimize the right metrics in your business. This knowledge can help you create KPIs for your business and craft a business strategy based on what’s really happening in the online consumer world.
eCommerce abandonment statistics
eCommerce abandonment or cart abandonment is what happens when an online shopper adds items to their online cart but then exits the site before completing the purchase.
7. eCommerce abandonment statistics from 2020 reveal that 88.05% of online cart orders were abandoned before the payment step.
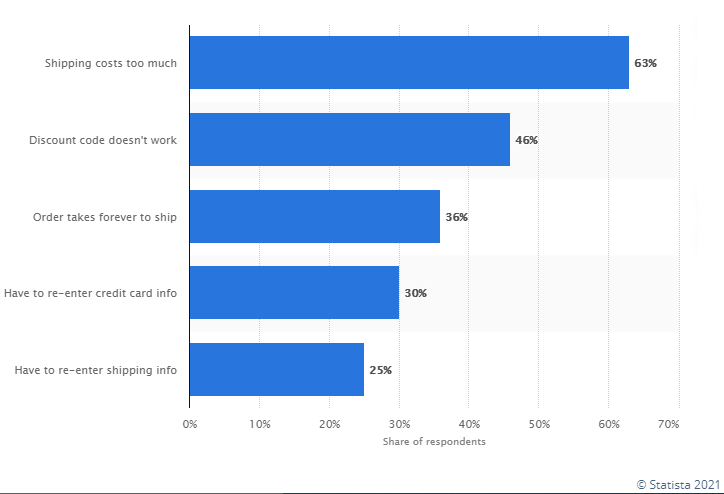
8. According to Statista data from 2018, the main reason for ecommerce abandonment in the US is higher-than-expected shipping costs. The second top reason is non-functioning discount codes, which can cease to function if they’ve expired, aren’t relevant to that specific product list, or for technical reasons.
Key takeaway:
As the facts show that cart abandonment is a very real cause of a major loss of sales and revenue, ecommerce store owners can focus their attention on lowering their store’s abandonment rate. It seems a shame to invest in getting a potential customer all the way through your sales funnel only to have the order abandoned before payment is made.
Here are some ways you as a store owner can reduce your cart abandonment rates:
- Offer free shipping or fast shipping at discounted rates
- Ensure you have multiple payment options available
- Simplify your checkout process
eCommerce return rate statistics
The ecommerce return rate is the percentage of online shoppers who land up returning the product they bought online to the merchant.
9. The ecommerce return rate statistics show that the ecommerce rate is significantly higher than the traditional retail return rate, with a minimum of 30% of products bought online being returned as opposed to a return rate of only 8.89% of products bought in a physical store.
10. 92% of shoppers would rebuy from an online store if the return process is simple
11. 79% of online shoppers expect free return shipping
12. Approximately 49% of ecommerce stores provide free return shipping
13. Reasons for product returns: faulty products (20%), product not what expected (22%), wrong item (23%), other reasons (35%)
Key takeaway:
Your ecommerce return strategy can have a big impact on your store’s profits.
This is what you can do, based on these ecommerce facts and figures, to reduce your return rates:
- For clothing, provide detailed sizing guides
- Provide top-notch customer service to try to resolve the issue before return
- Create descriptive product pages with full product details, use-case videos and more
eCommerce conversion rate statistics
eCommerce conversion rate is the percentage of ecommerce store visitors that complete the buying process and purchase from an online store.
14. While the global average conversion rate across all devices is 2.58%, ecommerce conversion rate statistics vary based on the industry, device and other factors, for example:
15. The desktop conversion rate is on average 4.14% compared to the mobile conversion rate of 1.82%
16. Top-performing ecommerce stores typically have a conversion rate of at least 11%
17. Food and beverage sites experience the highest conversion rate (4.95%) while sporting goods stores typically have the lowest ecommerce conversion rate (2.35%)
eCommerce delivery statistics
Without a doubt, delivery is one of the most important aspects of ecommerce and the ecommerce delivery statistics back this statement up:
18. The number one reason consumers shop online is free delivery (Oberlo)
19. 43% of online shoppers research delivery costs before purchasing
20. 54% of Generation Zers state same-day shipping as their most important purchase driver
Key takeaway:
As the ecommerce facts and figures show, customers not only expect free shipping – they also expect fast (sometimes even same-day delivery). Amazon has set the bar really high for other ecommerce retailers, a bar that is difficult to reach. But there are ways to meet consumers’ delivery expectations without breaking the bank and digging into your margins.
- Require customers to reach a certain minimum AOV (average order value) to qualify for free shipping
- If you can’t offer speedy shipping, keep customers constantly updated on the status of their order
- Look for ways to cut shipping costs, for example, by minimizing packaging to only what’ necessary
Social media ecommerce statistics
According to data by BigCommerce, 43% of shoppers globally conduct product research via social media channels and 30% of online consumers stipulate that they would likely buy through a social media channel such as Facebook, Instagram, Snapchat, Twitter or Pinterest. eMarketer expects social commerce sales to surge by 34.8% in 2021 to reach $31.4 billion.
Instagram ecommerce statistics
21. 60% of consumers find new products on Instagram
22. Instagram ecommerce statistics from Instagram data show that over 200 million users visit a minimum of one business profile every day
Facebook ecommerce statistics
23. Facebook has 2.74 billion monthly active users
24. Facebook ecommerce statistics show that 78% of US consumers have found products through Facebook
25. 18.3% of U.S. adults made a purchase through Facebook in the last year
eCommerce in 2021 – looking forward
With COVID and serial lockdowns in our wake, e-commerce has established itself as the go-to shopping choice for consumers worldwide.
While the ecommerce boom of 2020 is expected to continue through 2021, it’s crucial to keep monitoring your own store’s statistics to make sure that you’re making the most of this increased demand. Click To TweetThose in the know have even gone so far as to predict that by 2040 almost 95% of all purchases will be made online through ecommerce.
Using the BeProfit profit calculator dashboard will enable you to stay on top of your store’s data and make data-driven decisions for your business.
Based on the statistics from 2020, the top three things to implement in your ecommerce store in 2021 include:
- Selling products directly on social media channels (social commerce)
- Improving your shipping fees and delivery times
- Reducing your cart abandonment rates


 Please wait...


